29 KiB
🧭 Not sure where to start ? Open the WFGY Engine Compass
WFGY System Map
(One place to see everything; links open the relevant section.)
| Layer | Page | What it’s for |
|---|---|---|
| ⭐ Proof | WFGY Recognition Map | External citations, integrations, and ecosystem proof |
| ⚙️ Engine | WFGY 1.0 | Original PDF-based tension engine blue |
| ⚙️ Engine | WFGY 2.0 | Production tension kernel and math engine for RAG and agents. |
| ⚙️ Engine | WFGY 3.0 | TXT-based Singularity tension engine (131 S-class set) |
| 🗺️ Map | Problem Map 1.0 | Flagship 16-problem RAG failure checklist and fix map |
| 🗺️ Map | Problem Map 2.0 | RAG-focused recovery pipeline |
| 🗺️ Map | Problem Map 3.0 | Global Debug Card - image as a debug protocol layer - 🔴 YOU ARE HERE 🔴 |
| 🗺️ Map | Semantic Clinic | Symptom → family → exact fix |
| 🧓 Map | Grandma’s Clinic | Plain-language stories, mapped to PM 1.0 |
| 🏡 Onboarding | Starter Village | Guided tour for newcomers |
| 🧰 App | TXT OS | .txt semantic OS - 60-second boot |
| 🧰 App | Blah Blah Blah | Abstract/paradox Q&A (built on TXT OS) |
| 🧰 App | Blur Blur Blur | Text-to-image with semantic control |
| 🧰 App | Blow Blow Blow | Reasoning game engine & memory demo |
| 🧪 Research | Semantic Blueprint | Modular layer structures (future) |
| 🧪 Research | Benchmarks | Comparisons & how to reproduce |
| 🧪 Research | Value Manifest | Why this engine creates $-scale value |
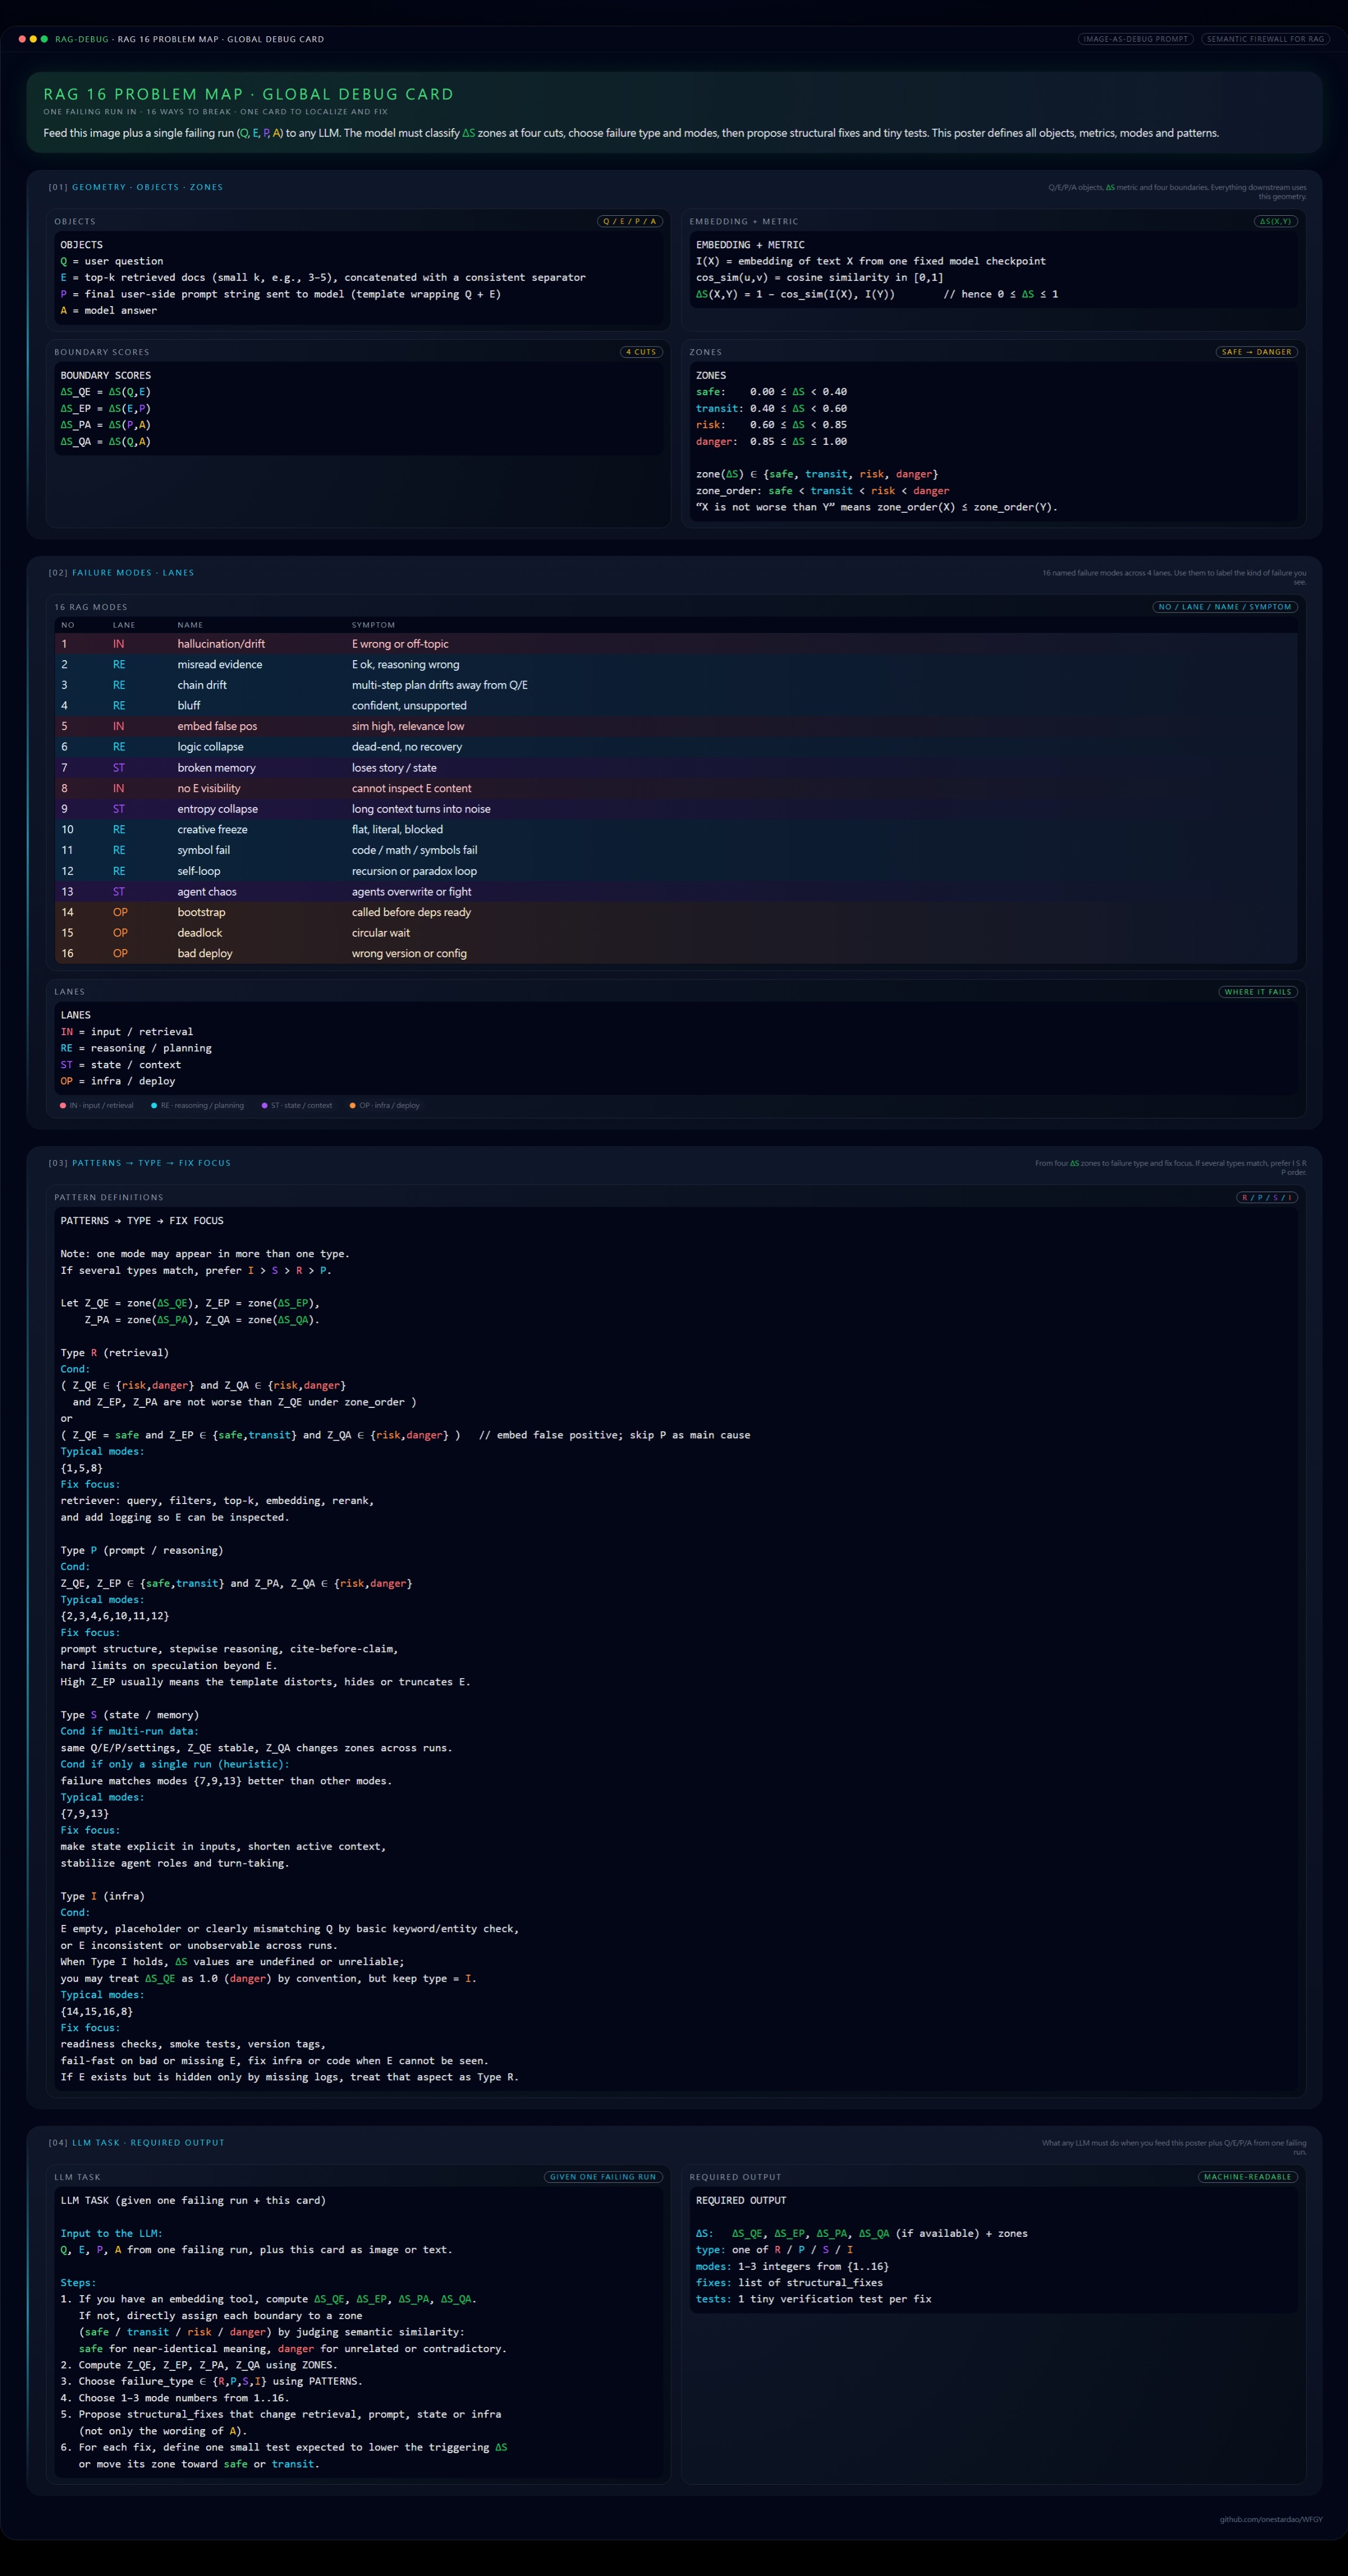
🚀 WFGY 3.0 · RAG 16 Problem Map · Global Debug Card
Image as a Structured Debug Prompt for RAG / Agent Pipelines
🌐 Recognition & ecosystem integration
As of 2026-03, the WFGY RAG 16 Problem Map line has been adopted or referenced by 20+ frameworks, academic labs, and curated lists in the RAG and agent ecosystem. Most external references use the WFGY ProblemMap as a diagnostic layer for RAG / agent pipelines, not the full WFGY product stack. A smaller but growing set also uses WFGY 3.0 · Singularity Demo as a long-horizon TXT stress test.
Some representative integrations:
| Project | Stars | Segment | How it uses WFGY ProblemMap | Proof (PR / doc) |
|---|---|---|---|---|
| RAGFlow |  |
Mainstream RAG engine | Adds a RAG failure modes checklist guide in its official docs, adapted from the WFGY 16-problem failure map for step-by-step RAG pipeline diagnostics. | PR #13204 |
| LlamaIndex |  |
Mainstream RAG infra | Integrates the WFGY 16-problem RAG failure checklist into its official RAG troubleshooting docs as a structured failure-mode reference. | PR #20760 |
| ToolUniverse (Harvard MIMS Lab) |  |
Academic lab / tools | Provides a WFGY_triage_llm_rag_failure tool that wraps the 16-mode map for incident triage. |
PR #75 |
| Rankify (Univ. of Innsbruck) |  |
Academic lab / system | Uses the 16 failure patterns in RAG and re-ranking troubleshooting docs. | PR #76 |
| Multimodal RAG Survey (QCRI LLM Lab) |  |
Academic lab / survey | Cites WFGY as a practical diagnostic resource for multimodal RAG. | PR #4 |
For the complete 20+ project list (frameworks, benchmarks, curated lists), see the 👉 WFGY Recognition Map
If your project uses the WFGY ProblemMap and you would like to be listed, feel free to open an issue or pull request in this repository.
A production-first failure map for RAG / agent pipelines, compressed into one portable image. The poster defines objects, metrics, ΔS zones, failure types, and mode patterns in a single unified view.
Feed a failing run (Q, E, P, A) plus this card to any LLM.
It returns type → mode(s) → fixes → verification tests.
No external framework required.
How to use (60 seconds)
- Download the full-resolution Debug Card from this repository.
- Upload the image to any strong LLM.
- Paste your failing run context:
Q= user questionE= top-k retrieved evidenceP= final prompt sent to the modelA= model output- plus logs/metrics if available
- Ask the model to diagnose using the 16-Problem Map and propose fixes with one test per fix.
Expected output:
- ΔS zones (or best-effort estimate)
- failure type:
R / P / S / I - 1–3 matching modes (1–16)
- structural fixes + verification tests
📥 Download the original full-resolution image directly from this repository.
If this helps you, consider leaving a ⭐ — it helps more developers discover this project.

Colab MVP · Wave 0 (one-click runnable)
Wave 0 is the first executable form of the Global Debug Card protocol.
It loads the machine-readable specs, parses one debug packet, and renders a structured triage summary in a single Colab cell. No LLM. No local setup.
![]()
What it demonstrates
- JSON problem catalog can be consumed programmatically
- Debug packet structure is tool-friendly and stable
- Triage output can be reproduced deterministically
Wave 0 scope
- Modes: No.1, No.2, No.5, No.8
- Single synthetic failure case
- Single-cell execution
This is the minimal proof that the Global Debug Card can run as code, not just as a human-readable poster.
Machine-Readable JSON Specs · Wave 0 (live)
This page has a Wave 0 version of the machine-readable protocol for the Global Debug Card. The goal is simple:
The same debugging logic that lives on the poster should also exist as a stable JSON contract.
Wave 0 ships two JSON specs, both already used by the Colab MVP.
1. Problem catalog
- File path:
ProblemMap/specs/wfgy_problem_catalog_v1.json - Direct link:
wfgy_problem_catalog_v1.json
What it contains:
- version and description fields
- timestamp of last update
- lane definitions:
IN= input / retrievalRE= reasoning / planningST= state / memoryOP= infra / deploy
- type definitions:
R/P/S/Ias the main failure families
- a
wave0_scopeblock that documents:- Wave 0 focuses on modes 1, 2, 5, 8
- the catalog is expected to grow in future waves
- a
modesarray, where each mode includes:idand short code (for exampleIN-1)- lane
- default failure type
- title and short symptom text
- primary and secondary signals
- high-level fix focus
This catalog is meant to be read-only for tools. New modes or fields may be added in the future, but existing keys should remain compatible.
2. Debug packet
- File path:
ProblemMap/specs/wfgy_debug_packet_v1.json - Direct link:
wfgy_debug_packet_v1.json
What it contains:
- version and description
- top-level metadata such as
last_updated_utc - a
required_fieldssection, defining the minimal keys a packet must include:idcreated_utcenvironmentqepa
optional_fields, including:metricslabelstriage_notesfix_plan
field_specsthat describe:- the type of each field
- a short description
- examples where helpful
- an
example_packetwhich shows:- a realistic RAG failure around a support-ticket summary
- concrete values for
q,e,p,a - a small metrics block
- lane / mode labels for Wave 0
- a compact fix plan and verification tests
The debug packet spec is designed so that:
- any tool can emit one JSON object that follows this shape
- the Colab MVP, or a future agent, can read the object and:
- infer mode information
- print a triage summary
- compare before vs after
Relationship to the poster
The JSON layer does not replace the image. Instead, it mirrors the same structure in a way that software can consume:
- the poster is the fastest way for a human and an LLM to triage a new failure
- the JSON specs are the way for tools to replay and track those failures over time
Wave 0 is intentionally minimal but fully working. Later waves are expected to:
- broaden mode coverage
- add richer metrics and thresholds
- align with concrete ΔS computation recipes
- document versioning and compatibility guarantees
Environment Coverage
- MLflow · Experiment tracking & RAG debugging · Medium Article
- Dask · Distributed execution & task orchestration · Medium Article
- Kedro · Pipeline structuring & ML workflow management · Medium Article
FAQ
Do I need all four objects `(Q, E, P, A)` to use the Global Debug Card?
The best results come from having all four objects:
Q= user questionE= retrieved evidenceP= final prompt sent to the modelA= model output
This gives the card the full diagnostic chain from intent to evidence to prompt to answer.
If one object is missing, the card can still be used for partial triage:
- missing
Pusually means rough classification is still possible - missing
Eoften points to observability or infra-side issues - missing both
EandPreduces accuracy, but the card can still help identify likely failure families
In short: all four objects are ideal, but partial inputs can still be useful for first-pass diagnosis.
Can the Global Debug Card partially automate RAG debugging?
Yes, partially.
The card is well suited for:
- structured triage
- first-pass failure classification
- matching likely problem modes
- proposing repair directions
- defining one verification test per fix
This means it can help automate the early part of debugging very well.
What it does not guarantee is a one-click, fully automatic repair for every RAG failure. Some cases still require human review, domain context, or deeper system changes.
The current design goal is not "magic auto-fix." The goal is to turn messy debugging into a repeatable protocol.
Can tools like OpenClaw use this card to automatically resolve RAG issues?
Yes, for some classes of issues.
A tool like OpenClaw can use the Global Debug Card as a diagnostic layer:
- collect
(Q, E, P, A) - run classification
- emit a structured debug packet
- apply one constrained repair action
- re-run a verification check
This is most realistic for problems where the repair loop is narrow and testable.
Best early targets include:
- No.1 retrieval wrong or off-topic
- No.5 semantic vs embedding mismatch
- No.8 missing evidence visibility
- parts of No.2 interpretation collapse
These are good candidates because they often respond to:
- retrieval parameter changes
- query rewrite
- re-ranking
- logging and observability upgrades
- constrained prompt repair
Harder cases, such as long-horizon reasoning errors or deep architectural flaws, usually should not be treated as fully automatic fixes in the first wave.
What can the first Colab MVP actually automate?
The first Colab MVP is designed as a first-pass repair loop, not a full autonomous debugger.
Its planned job is:
- accept one failing case from
(Q, E, P, A) - compute or estimate the diagnostic structure
- emit a machine-readable debug packet
- apply one constrained patch
- re-check one or more verification signals
This makes the first public notebook useful for:
- reproducible triage
- small repair experiments
- before/after comparisons
- documenting how one failure was improved
The first Colab MVP is intended to prove the protocol works in practice. It is not meant to solve every failure mode automatically on day one.
Which problem modes are best suited for automated debugging first?
The best first-wave targets are the modes that are both:
- easy to observe
- narrow enough to repair with a constrained loop
The strongest early candidates are:
-
No.1 retrieval wrong or off-topic
Good for top-k sweeps, query rewrite, filter tightening, and re-ranking. -
No.5 semantic vs embedding mismatch
Good for embedding checks, chunking review, normalization review, and retrieval alignment tests. -
No.8 missing evidence visibility
Good for observability upgrades, evidence logging, and packet completeness checks. -
No.2 interpretation collapse
Good for constrained prompt repair, evidence-first answer patterns, and citation-before-claim checks.
These modes are ideal for Wave 0 because they can often be improved without rebuilding the entire stack.
What will the machine-readable JSON MVP be used for?
The JSON MVP is the protocol layer for tools.
It is meant to make the card usable by:
- agent runners
- CI workflows
- internal debugging tools
- replay and comparison pipelines
The planned JSON layer has two main roles:
-
Problem catalog JSON
A machine-readable version of the 16-mode map, including mode IDs, signals, and default repair directions. -
Debug packet JSON
A stable result format for one diagnosis run, including the detected type, likely modes, fixes, and verification steps.
The JSON layer does not replace the image workflow. It makes the same logic consumable by software.
Can I plug this into my own agent runner, CI, or internal tooling?
Yes, that is one of the intended directions.
If your system can provide a minimal case record such as:
QEPA
then it can likely be adapted to this protocol.
Additional metadata can improve results, for example:
- retrieval scores
- model name
- chunk IDs
- timing logs
- prompt template version
- index configuration
The final goal is simple:
your system emits one case, the protocol emits one debug packet.
That makes the card easier to integrate into real workflows than a free-form debugging conversation.
Is this meant to replace human debugging?
No.
The purpose of the Global Debug Card is to improve the first stage of debugging:
- shared vocabulary
- structured triage
- clearer diagnosis
- repeatable verification steps
It is not meant to remove human judgment.
Human review is still important for:
- high-risk changes
- domain-specific correctness
- architecture-level redesign
- policy or safety decisions
- ambiguous multi-cause failures
A good way to think about it is:
this card reduces debugging chaos, but humans still decide the final repair strategy.
Do I need embeddings to use this page?
No, but embeddings make the protocol stronger.
The full diagnostic model uses structured similarity and boundary reasoning. That works best when a fixed embedding model is available.
However, the card is still useful without embeddings:
- a strong LLM can estimate likely drift patterns from the visible objects
- the image workflow can still guide manual or semi-structured triage
- rough type and mode guesses can still be generated from the failure pattern
So there are two valid usage modes:
- image + reasoning workflow for fast manual triage
- embedding + packet workflow for stronger, machine-runnable diagnosis
What is the difference between the image workflow and the JSON workflow?
They use the same logic, but they serve different users.
Image workflow
- optimized for humans
- easy to use immediately
- works by uploading the card and pasting
(Q, E, P, A) - good for fast triage with any strong LLM
JSON workflow
- optimized for tools
- intended for automation and integration
- produces stable, machine-readable outputs
- good for replay, comparison, and agent orchestration
In short:
- the image workflow is the human entry point
- the JSON workflow is the machine entry point
Both are two views of the same protocol.
Why not just paste logs into any strong LLM and ask it to debug?
You can do that, and sometimes it helps. But without a shared protocol, the output is often inconsistent.
Raw free-form debugging usually has these problems:
- no shared object model
- no fixed failure vocabulary
- no stable mapping from symptoms to modes
- no required verification step
- hard to compare two runs consistently
The Global Debug Card adds structure:
- the same four objects
- the same failure families
- the same mode vocabulary
- the same output expectation
- the same repair-and-test pattern
That makes debugging more reproducible and much easier to turn into automation.
How far can the Global Debug Card be pushed?
The short answer is: much further than a static poster.
At minimum, it is already useful as:
- an image-based triage layer
- a shared RAG debugging vocabulary
- a structured prompt for diagnosis
With the next layers added, it can grow into:
- a Colab-based repair loop
- a machine-readable incident format
- a replayable before/after comparison tool
- an agent-facing debug protocol
- a lightweight regression-check layer for RAG systems
So the long-term direction is not "just a card."
The long-term direction is:
- from image prompt
- to structured diagnosis
- to partial automation
- to reproducible repair loops
- to a reusable protocol for RAG debugging
Can this help reduce hallucinations without changing the whole stack?
Often, yes.
One of the main strengths of the card is that it works as a diagnostic layer, not a full replacement stack.
That means teams can often improve reliability by first identifying:
- whether the problem is retrieval
- whether the prompt is the main source of drift
- whether evidence visibility is missing
- whether the issue is state or infra-related
This allows smaller, more targeted fixes:
- retrieval tuning
- prompt repair
- re-ranking
- observability upgrades
- packet completeness checks
In many real cases, that is much cheaper than rebuilding the whole system.
Can this support replay, A/B comparison, and before/after repair loops?
Yes, and that is one of the strongest next-step directions.
Once a failure case is captured in a structured form, the same case can be replayed under different settings:
- different top-k values
- different retrievers
- different chunking strategies
- different prompt templates
- different repair actions
This makes it possible to compare:
- before vs after
- setup A vs setup B
- manual fix vs automated fix
That is one reason the Colab MVP and JSON MVP matter. They move the card from "diagnostic poster" toward "replayable debugging protocol."
What should I submit if I want my failing case to become a reproducible example?
The best submission is a minimal but complete failure packet.
Recommended input:
Q= the original user questionE= retrieved evidence or top-k chunksP= the final prompt sent to the modelA= the model output- any relevant logs or metrics
- optional notes about the expected correct behavior
You should remove private or sensitive data before sharing.
A good reproducible example does not need to be large. It just needs to preserve the failure pattern clearly enough for the protocol to analyze.
That kind of example is ideal for future Colab demos, test cases, and repair-loop comparisons.