11 KiB
Pulse
Real-time monitoring for Proxmox, Docker, Kubernetes, and TrueNAS infrastructure.


🚀 Overview
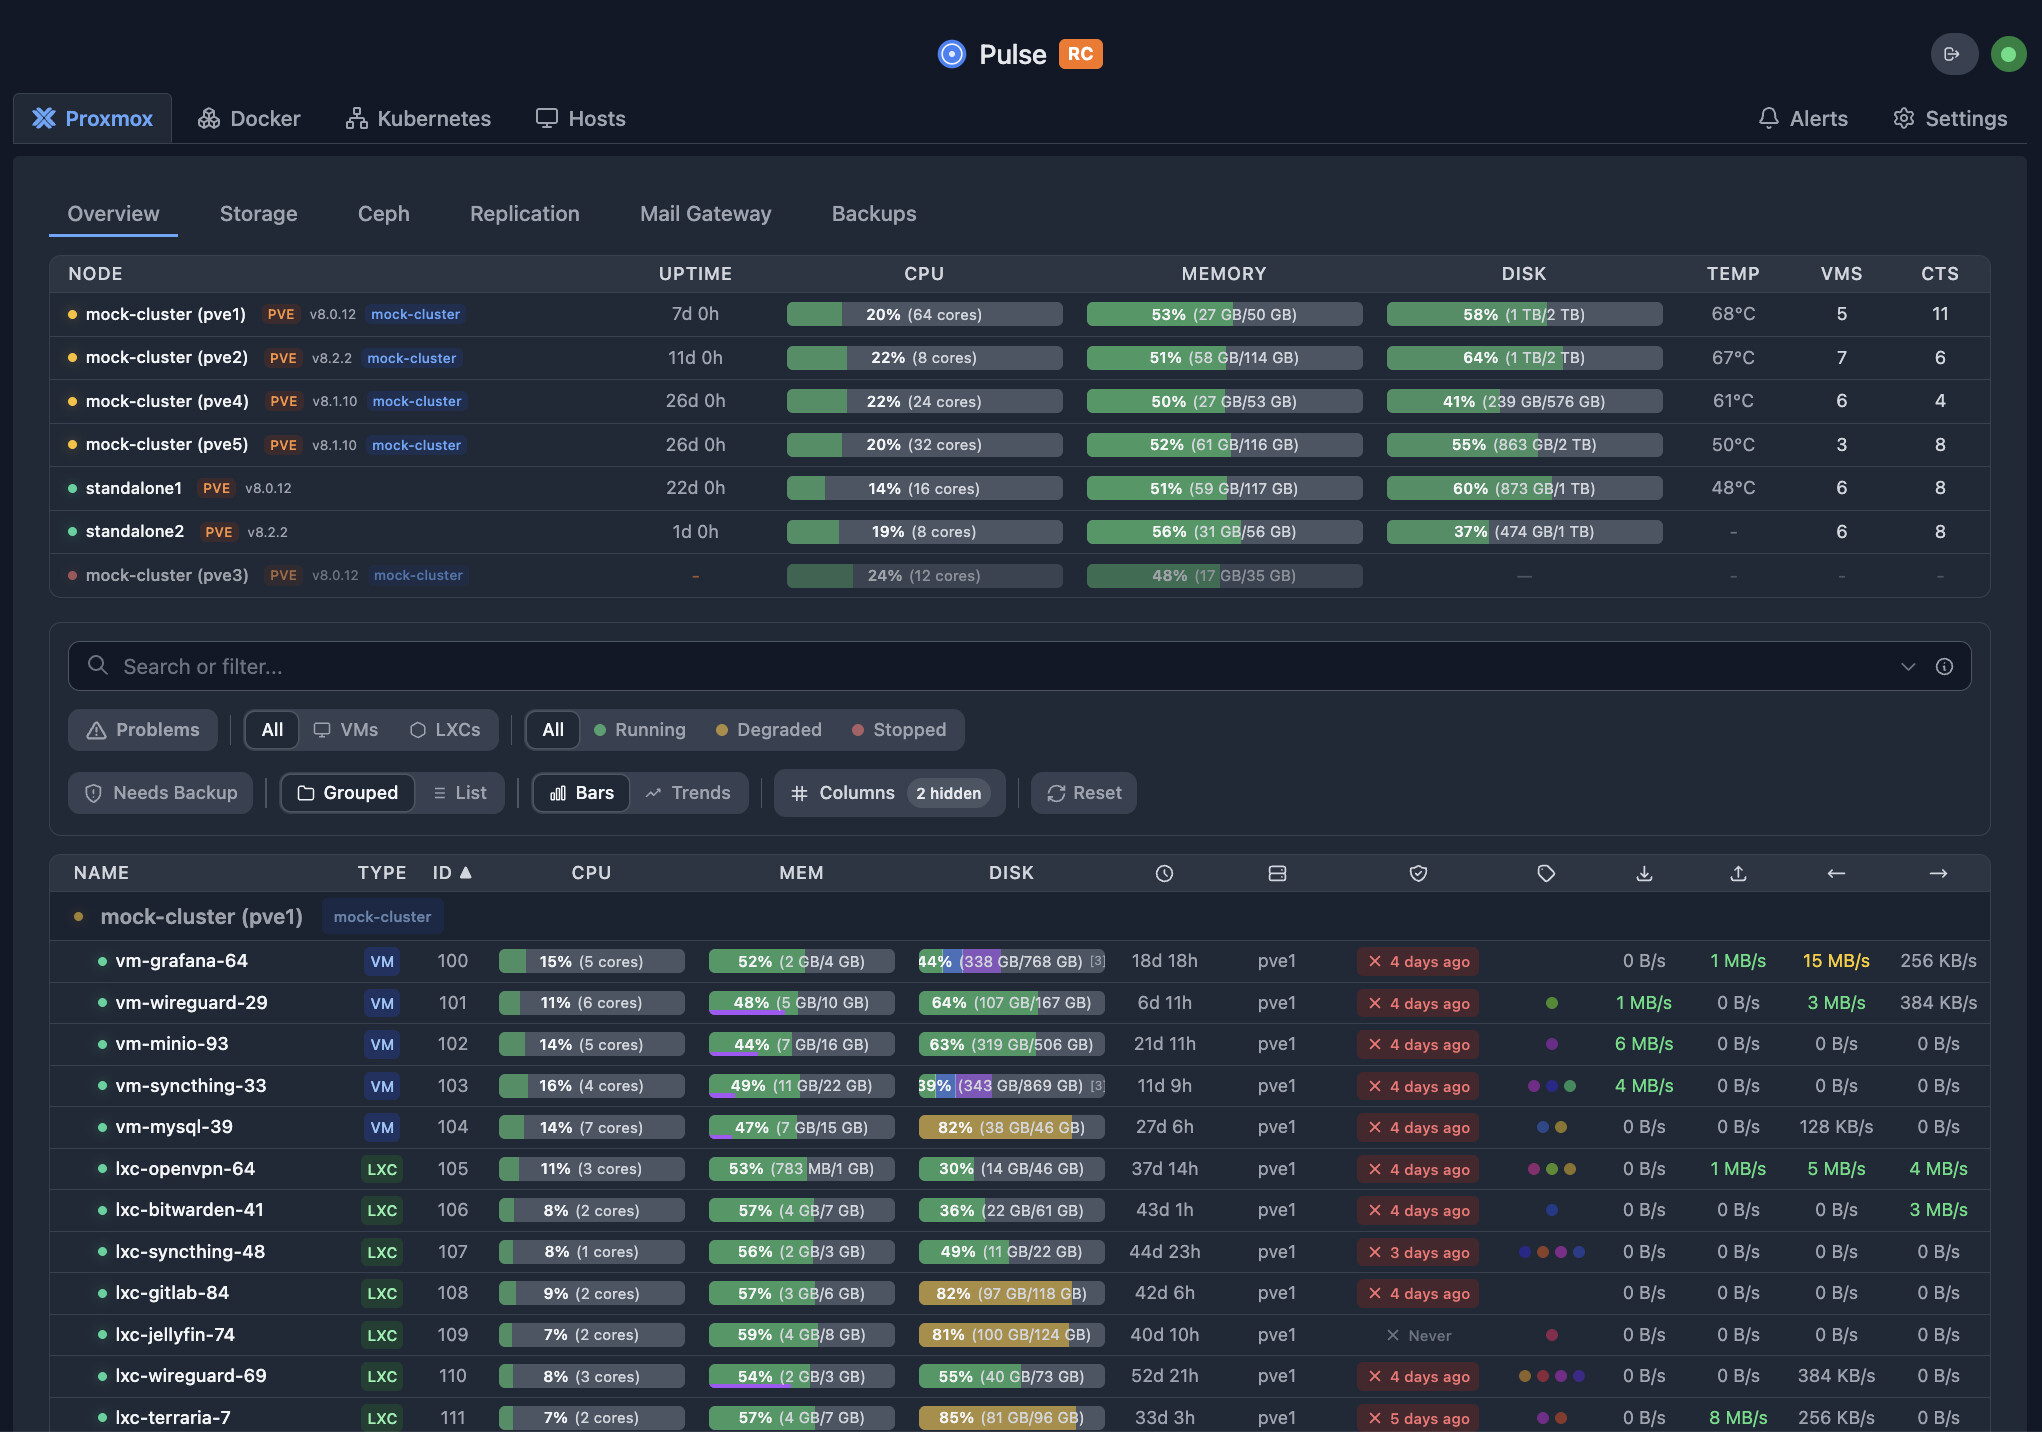
Pulse is a modern, unified dashboard for monitoring your infrastructure across Proxmox, Docker, Kubernetes, and TrueNAS. It consolidates metrics, alerts, and AI-powered insights from all your systems into a single, beautiful interface.
Designed for homelabs, sysadmins, and MSPs who need a "single pane of glass" without the complexity of enterprise monitoring stacks.
🧭 Unified Navigation
Pulse now groups everything by task instead of data source:
- Infrastructure for hosts and nodes
- Workloads for VMs, containers, and Kubernetes pods
- Storage and Backups as top-level views
- PMG now routes into Infrastructure (source filter), and Kubernetes routes into Workloads (K8s filter)
- Legacy URLs are no longer routed as compatibility aliases; use canonical v6 routes.
Power-user shortcuts:
g i→ Infrastructure,g w→ Workloads,?→ shortcuts help/orCmd/Ctrl+K→ global search
✨ Features
Core Monitoring
- Unified Monitoring: View health and metrics for PVE, PBS, PMG, Docker, Kubernetes, and TrueNAS in one place
- Smart Alerts: Get notified via Discord, Slack, Telegram, Email, and more
- Auto-Discovery: Automatically finds Proxmox nodes on your network
- Metrics History: Persistent storage with configurable retention
- Recovery Central: Unified backup/snapshot/replication timeline across PBS and TrueNAS
AI-Powered
- Chat Assistant (BYOK): Ask questions about your infrastructure in natural language
- Patrol: Background health checks that generate findings on a schedule. Activated or trial-backed installs can use 25 Patrol quickstart runs with no API key for initial Patrol setup; otherwise self-hosted use is BYOK.
- Alert Analysis (Pro/Pro+/Cloud): Optional AI analysis when alerts fire
- Cost Tracking: Track usage and costs per provider/model
Multi-Platform
- Proxmox VE/PBS/PMG: Full monitoring and management
- TrueNAS: Pools, datasets, disks, ZFS snapshots, replication tasks, and alerts
- Kubernetes: Complete K8s cluster monitoring via agents
- Docker/Podman: Container and Swarm service monitoring
- OCI Containers: Proxmox 9.1+ native container support
Security & Operations
- Secure by Design: Credentials encrypted at rest, strict API scoping, agent commands disabled by default
- One-Click Updates: Easy upgrades for supported deployments
- OIDC/SSO/SAML: Single sign-on with multi-provider support
- Mobile Remote Access: Relay protocol with end-to-end encryption for supported Pulse Mobile clients (Relay and above)
- Privacy Focused: Anonymous telemetry is enabled by default and fully documented — no hostnames, credentials, or personal data is ever sent. Disable any time in Settings or via
PULSE_TELEMETRY=false.
⚡ Quick Start
Option 1: Proxmox LXC (Recommended)
Run this one-liner on your Proxmox host to create a lightweight LXC container:
curl -fsSL https://github.com/rcourtman/Pulse/releases/latest/download/install.sh | bash
Note: this installs the Pulse server. Agent installs use the command generated in Settings → Unified Agents → Installation commands (served from /install.sh on your Pulse server).
Option 2: Docker
docker run -d \
  --name pulse \
  -p 7655:7655 \
  -v pulse_data:/data \
  --restart unless-stopped \
  rcourtman/pulse:latest
Access the dashboard at http://<your-ip>:7655.
Local Development
Use the managed dev runtime from the repo root:
npm run dev
Open http://127.0.0.1:5173 in the browser. 5173 is the frontend dev shell,
and it proxies /api and /ws to the backend on 7655. 7655 is the backend
dependency for API and websocket traffic, not the primary browser URL for local
frontend development.
Canonical local dev commands:
npm run dev— start the managed runtime and reclaim the canonical dev ports if an older unmanaged session is still using themnpm run dev:status— show frontend shell health, proxied API health, direct backend health, and listener ownershipnpm run dev:verify— run the managed browser proof pack against the live dev runtime, including runtime recovery, the Patrol blocked-runtime page contract, and the desktop Recovery layout guard while the launcher suppresses unrelated backend rebuild churn for the duration of the proof packnpm run dev:logs— tail the managed runtime lognpm run dev:backend-restart— bounce only the managed backend through the launcher contractnpm run dev:stop— stop the managed runtimenpm run dev:foreground— run the foreground hot-reload launcher intentionally if you need an attached shell
If npm run dev:verify passes, the managed dev shell, proxy path, backend
health endpoint, browser recovery path, Patrol blocked-runtime page behavior,
and Recovery desktop history-table layout are all aligned.
📚 Documentation
- Installation Guide: Detailed instructions for Docker, Kubernetes, and bare metal.
- Upgrade to v6: Migration guide for upgrading from v5 to v6.
- Configuration: Setup authentication, notifications, and advanced settings.
- Security: Learn about Pulse's security model and best practices.
- API Reference: Integrate Pulse with your own tools.
- Architecture: High-level system design and data flow.
- AI Features: Pulse Assistant (Chat) and Pulse Patrol documentation.
- Multi-Tenant: Enterprise multi-tenant setup and configuration.
- Troubleshooting: Solutions to common issues.
- Agent Security: Details on checksum-verified updates and verification.
- Docker Monitoring: Setup and management of Docker agents.
- Unified Navigation: Guide to the new task-based navigation.
🌐 Community Integrations
Community-maintained integrations and addons:
- Home Assistant Addons - Run Pulse Agent and Pulse Server as Home Assistant addons.
💳 Plans (Community / Relay / Pro / Pro+ / Cloud)
Pulse is full-featured for core monitoring in every tier. Self-hosted pricing now sells monitored coverage by monitored system, not by installed agent. Cloud and MSP pricing are unchanged.
Self-hosted tiers:
| Plan | Price | Included monitored systems | Metric history | Key upgrade |
|---|---|---|---|---|
| Community | Free | 5 | 7 days | Core monitoring for one real small lab |
| Relay | $4.99/mo or $39/yr | 8 | 14 days | Remote access, mobile, and push notifications |
| Pro | $8.99/mo or $79/yr | 15 | 90 days | AI investigation, auto-fix, and operations tooling |
| Pro+ | $14.99/mo or $129/yr | 50 | 90 days | More room for larger self-hosted labs |
Pulse counts top-level monitored systems once no matter how they are collected. VMs, containers, pods, disks, backups, and other child resources under that system are included rather than counted separately.
Community keeps Patrol available with BYOK. Activated or trial-backed installs can also use Patrol quickstart for first-run activation: 25 Patrol runs with no API key on a server-verified install. Without activation, self-hosted Patrol continues with your configured provider. Relay remains the convenience tier, and Pro/Pro+ are the paid operations tiers.
Runtime-aligned capability summary:
| Capability | Community | Relay | Pro | Pro+ | Cloud |
|---|---|---|---|---|---|
| Pulse Patrol (Background Health Checks) | ✅ | ✅ | ✅ | ✅ | ✅ |
| Remote Access / Mobile / Push | — | ✅ | ✅ | ✅ | ✅ |
| Alert Analysis | — | — | ✅ | ✅ | ✅ |
| Pulse Patrol Auto-Fix | — | — | ✅ | ✅ | ✅ |
| Kubernetes Analysis | — | — | ✅ | ✅ | ✅ |
| Centralized Agent Profiles | — | — | ✅ | ✅ | ✅ |
| Update Alerts (Container/Package Updates) | ✅ | ✅ | ✅ | ✅ | ✅ |
| Basic SSO (OIDC) | ✅ | ✅ | ✅ | ✅ | ✅ |
| Advanced SSO (SAML/Multi-Provider) | — | — | ✅ | ✅ | ✅ |
| Role-Based Access Control (RBAC) | — | — | ✅ | ✅ | ✅ |
| Enterprise Audit Logging | — | — | ✅ | ✅ | ✅ |
| Advanced Infrastructure Reporting (PDF/CSV) | — | — | ✅ | ✅ | ✅ |
| Extended Metric History | 7 days | 14 days | 90 days | 90 days | Hosted entitlements |
Pulse Patrol runs on your schedule (every 10 minutes to every 7 days, default 6 hours) and finds:
- ZFS pools approaching capacity
- Backup jobs that silently failed
- VMs stuck in restart loops
- Clock drift across cluster nodes
- Container health check failures
On self-hosted installs, Pulse Patrol's steady-state path uses your configured provider (BYOK) from your Pulse server. The one hosted exception is Patrol quickstart: activated or trial-backed installs get 25 Patrol runs through the managed quickstart proxy so you can try Patrol before adding an API key. Unactivated Community installs should activate, start a trial, or use BYOK. Chat Assistant remains BYOK.
Technical highlights:
- Cross-system context (nodes, VMs, backups, containers, and metrics history)
- LLM analysis with your provider + alert-triggered deep dives (Pro/Pro+/Cloud)
- Optional auto-fix with command safety policies and audit trail
- Centralized agent profiles for consistent fleet settings
Try the live demo → or learn more at pulserelay.pro
Pulse plan technical details: docs/PULSE_PRO.md
❤️ Support Pulse Development
Pulse is maintained by one person. Sponsorships help cover the costs of the demo server, development tools, and domains. If Pulse saves you time, please consider supporting the project!


📄 License
MIT © Richard Courtman. Use of Pulse Pro is subject to the Terms of Service.