| .github | ||
| examples | ||
| hwdbg | ||
| hyperdbg | ||
| utils | ||
| .gitattributes | ||
| .gitignore | ||
| .gitmodules | ||
| CHANGELOG.md | ||
| CITATION.cff | ||
| CODE_OF_CONDUCT.md | ||
| CONTRIBUTING.md | ||
| CREDITS.md | ||
| doxyfile | ||
| HOWTO.md | ||
| LICENSE | ||
| README.md | ||




HyperDbg Debugger

HyperDbg Debugger is an open-source, hypervisor-assisted debugger for Windows (Linux support is currently under development!) with support for both user-mode and kernel-mode (native) debugging. It is built for reverse engineering, fuzzing, and advanced system analysis using modern hardware virtualization and tracing features.
You can follow HyperDbg on Twitter or Mastodon to get notified about new releases, or join any of the HyperDbg groups, where you can ask developers and open-source reversing enthusiasts for help setting up and using HyperDbg.
Description
HyperDbg is built around modern hardware virtualization technologies to introduce capabilities beyond those of traditional debuggers. It runs on top of the operating system by virtualizing an already running system using Intel VT-x and Extended Page Tables (EPT). By combining virtualization with advanced tracing technologies such as Intel Processor Trace (Intel PT), HyperDbg provides powerful tracing and Virtual Machine Introspection (VMI) capabilities.
Core Capabilities
HyperDbg provides a wide range of advanced debugging features, including several types of EPT-based hidden hooks. It can emulate hardware data breakpoints for monitoring memory reads, writes, and executions at specific address ranges while remaining transparent to both the operating system and target applications. Unlike hardware debug registers, these monitoring facilities are not limited by the number of available debug registers or size constraints. Moreover, HyperDbg is capable of tracking execution across different privilege levels, including transitions from user mode to kernel mode (e.g., through system calls, heaven's gate, faults, exceptions, and interrupts), from the kernel to device drivers, and from kernel mode back to user mode, enabling comprehensive analysis of the entire execution flow.
In addition, HyperDbg supports system call hooking, control flow tracing through hardware tracing features, and comprehensive monitoring of I/O operations, including both Memory-Mapped I/O (MMIO) and Port-Mapped I/O (PMIO), enabling detailed analysis of device interactions and external peripherals.
Beyond that, HyperDbg includes a large collection of additional events specifically designed for reverse engineering, malware analysis, and low-level program analysis. For a complete list of supported events and their documentation, refer to the full feature list.
HyperDbg is designed to operate as stealthily as possible. It does not use any debugging APIs to debug the operating system or any application, so classic anti-debugging methods will not detect it. It also includes a specialized module designed to enhance its stealth capabilities. This module monitors attempts to detect the presence of a hypervisor or debugger and applies various techniques to first report and then mitigate or bypass such detection mechanisms. Although complete transparency cannot be guaranteed in all scenarios, these features significantly increase the difficulty of detecting HyperDbg, making it substantially harder for applications, packers, software protectors, malware, anti-cheat systems, and other security mechanisms to identify its presence.
Why HyperDbg?
HyperDbg is harder to set up and use, and also requires deeper low-level system knowledge compared to traditional debuggers. However, it provides two major advantages:
-
Full System & OS Control
HyperDbg operates at the hypervisor level, giving you powerful capabilities that are simply not possible with classic debuggers. This allows you to leverage hardware-assisted features for advanced reverse engineering and debugging scenarios. -
Stealth & Detection Resistance
Since HyperDbg doesn't rely on standard OS debugging APIs, it is generally much harder (though not impossible) to detect. This makes it a strong choice when working against anti-debugging protections.
These advantages open up entirely new debugging and reverse engineering techniques that go beyond what conventional debuggers can offer.
Build & Installation
You can download the latest compiled binary files from releases; otherwise, if you want to build HyperDbg, you should clone HyperDbg with the --recursive flag.
git clone --recursive https://github.com/HyperDbg/HyperDbg.git
Please visit Build & Install and Quick Start for a detailed explanation of how to start with HyperDbg. You can also see the FAQ for more information, or if you previously used other native debuggers like GDB, LLDB, or WinDbg, you could see the command map.
Tutorials
The OpenSecurityTraining2's "Reversing with HyperDbg (Dbg3301)" tutorial series, available on OST2's website (preferred) and YouTube is the recommended way to get started with and learn HyperDbg. It guides you through the initial steps of using HyperDbg, covering essential concepts, principles, and debugging functionalities, along with practical examples and numerous reverse engineering methods that are unique to HyperDbg.
If you're interested in understanding the internal design and architecture of hypervisors and HyperDbg, you can read the Hypervisor From Scratch tutorials.
Publications
In case you use one of HyperDbg's components in your work, please consider citing our papers.
1. HyperDbg: Reinventing Hardware-Assisted Debugging (CCS'22) [arXiv]
@inproceedings{karvandi2022hyperdbg,
  title={HyperDbg: Reinventing Hardware-Assisted Debugging},
  author={Karvandi, Mohammad Sina and Gholamrezaei, MohammadHosein and Khalaj Monfared, Saleh and Meghdadizanjani, Soroush and Abbassi, Behrooz and Amini, Ali and Mortazavi, Reza and Gorgin, Saeid and Rahmati, Dara and Schwarz, Michael},
  booktitle={Proceedings of the 2022 ACM SIGSAC Conference on Computer and Communications Security},
  pages={1709--1723},
  year={2022}
}
Other paper built upon HyperDbg...
2. hwdbg: Debugging Hardware Like Software (EuroSec'25) [PDF]
@inproceedings{karvandi2025hwdbg,
  title={hwdbg: Debugging Hardware Like Software},
  author={Karvandi, Mohammad Sina and Meghdadizanjani, Soroush and Monfared, Saleh Khalaj and van der Kouwe, Erik and Slowinska, Asia},
  booktitle={Proceedings of the 18th European Workshop on Systems Security},
  pages={56--62},
  year={2025}
}
3. HyperEvade: Countering Anti-Debugging Techniques and Enhancing Transparency in Nested Virtualization using HyperDbg (DEBT'25) [PDF]
@article{ruytenberg2026hyperevade,
  title={HyperEvade: Countering Anti-Debugging Techniques and Enhancing Transparency in Nested Virtualization using HyperDbg},
  author={Ruytenberg, Bj{\"o}rn and Karvandi, Mohammad Sina},
  journal={Journal of Object Technology},
  volume={25},
  number={1},
  pages={1--3},
  year={2026},
  publisher={Association Internationale pour les Technologies Objets}
}
4. Digital Hole: Bypassing Commercial Audio DRM Solutions with DReaMcatcher (EuroSys'26) [PDF]
@inproceedings{ruytenberg2026digital,
  title={Digital Hole: Bypassing Commercial Audio DRM Solutions with DReaMcatcher},
  author={Ruytenberg, Bj{\"o}rn and Karvandi, Mohammad Sina and Bos, Herbert and van der Kouwe, Erik and Slowinska, Asia},
  booktitle={Proceedings of the 21st European Conference on Computer Systems},
  pages={484--496},
  year={2026}
}
5. TRM: An Efficient Hypervisor-Based Framework For Malware Analysis and Memory Reconstruction (AsiaCCS'26) [PDF]
@inproceedings{karvandi2026trm,
  title={TRM: An Efficient Hypervisor-Based Framework For Malware Analysis and Memory Reconstruction},
  author={Karvandi, Mohammad Sina and Meghdadizanjani, Soroush and Arasteh, Sima and Monfared, Saleh Khalaj and Fallah, Mohammad K and Gorgin, Saeid and Lee, Jeong-A and Slowinska, Asia and van der Kouwe, Erik},
  booktitle={Proceedings of the ACM Asia Conference on Computer and Communications Security},
  pages={68--82},
  year={2026}
}
You can also read this article as it describes the overall architecture, technical difficulties, design decisions, and internals of HyperDbg Debugger, this article about our efforts on vm-exit transparency, this article about chasing bugs within hypervisors, and this article about new reverse engineering techniques introduced in HyperDbg. More articles, posts, and resources are available at the awesome repo, and in addition, the slides repo provides presentation slides for further reference.
Unique Features
- Advanced Hypervisor-based Kernel Mode Debugger [link][link][link]
- Classic EPT Hook (Hidden Breakpoint) [link][link][link]
- Inline EPT Hook (Inline Hook) [link][link]
- Monitor Memory for R/W (Emulating Hardware Debug Registers Without Limitation) [link][link][link]
- SYSCALL Hook (Disable EFER & Handle #UD) [link][link][link]
- SYSRET Hook (Disable EFER & Handle #UD) [link][link]
- CPUID Hook & Monitor [link][link]
- RDMSR Hook & Monitor [link][link]
- WRMSR Hook & Monitor [link][link]
- RDTSC/RDTSCP Hook & Monitor [link]
- RDPMC Hook & Monitor [link]
- VMCALL Hook & Monitor [link]
- Debug Registers Hook & Monitor [link]
- I/O Port (IN Instruction) Hook & Monitor [link][link]
- I/O Port (OUT Instruction) Hook & Monitor [link][link]
- MMIO Monitor [link]
- Exception (IDT < 32) Monitor [link][link][link]
- External-Interrupt (IDT > 32) Monitor [link][link][link]
- Running Automated Scripts [link]
- Transparent-mode and Hyperevade Project (Anti-debugging and Anti-hypervisor Resistance) [link][link][link]
- Running Custom Assembly in Both VMX-root, VMX non-root (Kernel & User) [link]
- Checking for Custom Conditions [link][link]
- Process-specific & Thread-specific Debugging [link][link][link]
- VMX-root Compatible Message Tracing [link]
- Powerful Kernel Side Scripting Engine [link][link]
- Support To Symbols (Parsing PDB Files) [link][link]
- Mapping Data To Symbols & Create Structures, Enums From PDB Files [link][link][link]
- Event Forwarding (#DFIR) [link][link]
- Transparent Breakpoint Handler [link][link]
- Various Custom Scripts [link]
- HyperDbg Software Development Kit (SDK) [link]
- Event Short-circuiting [link][link]
- Tracking Records of Function Calls and Return Addresses [link]
- Kernel-level Length Disassembler Engine (LDE) [link][link]
- Memory Execution Monitor & Execution Blocking [link]
- Custom Page-fault Injection [link]
- Different Event Calling Stages [link]
- Injecting Custom Interrupts/Exceptions/Faults [link][link]
- Instant Events in the Debugger Mode [link]
- Detecting Kernel-to-user and User-to-kernel Transitions [link]
- Physical Memory Monitoring Hooks [link]
- Enumerating PCI/PCI-e Devices [link]
- Interpreting and Dumping PCI/PCI-e Configuration Space (CAM) [link]
- Dumping IDT Entries, I/O APIC, and Local APIC in XAPIC and X2APIC Modes [link][link][link]
- Triggering and Counting System Management Mode (SMM) Interrupts (SMIs) [link]
- Attaching to the User-mode Process and Preventing Execution [link]
- Intercepting Execution of XSETBV Instructions [link]
- Writing Library Script Files [link]
- Enhanced Portable Executable (PE) Parser [link]
- Tracing Branches using Last Branch Record (LBR) [link][link][link][link][link][link][link]
How does it work?
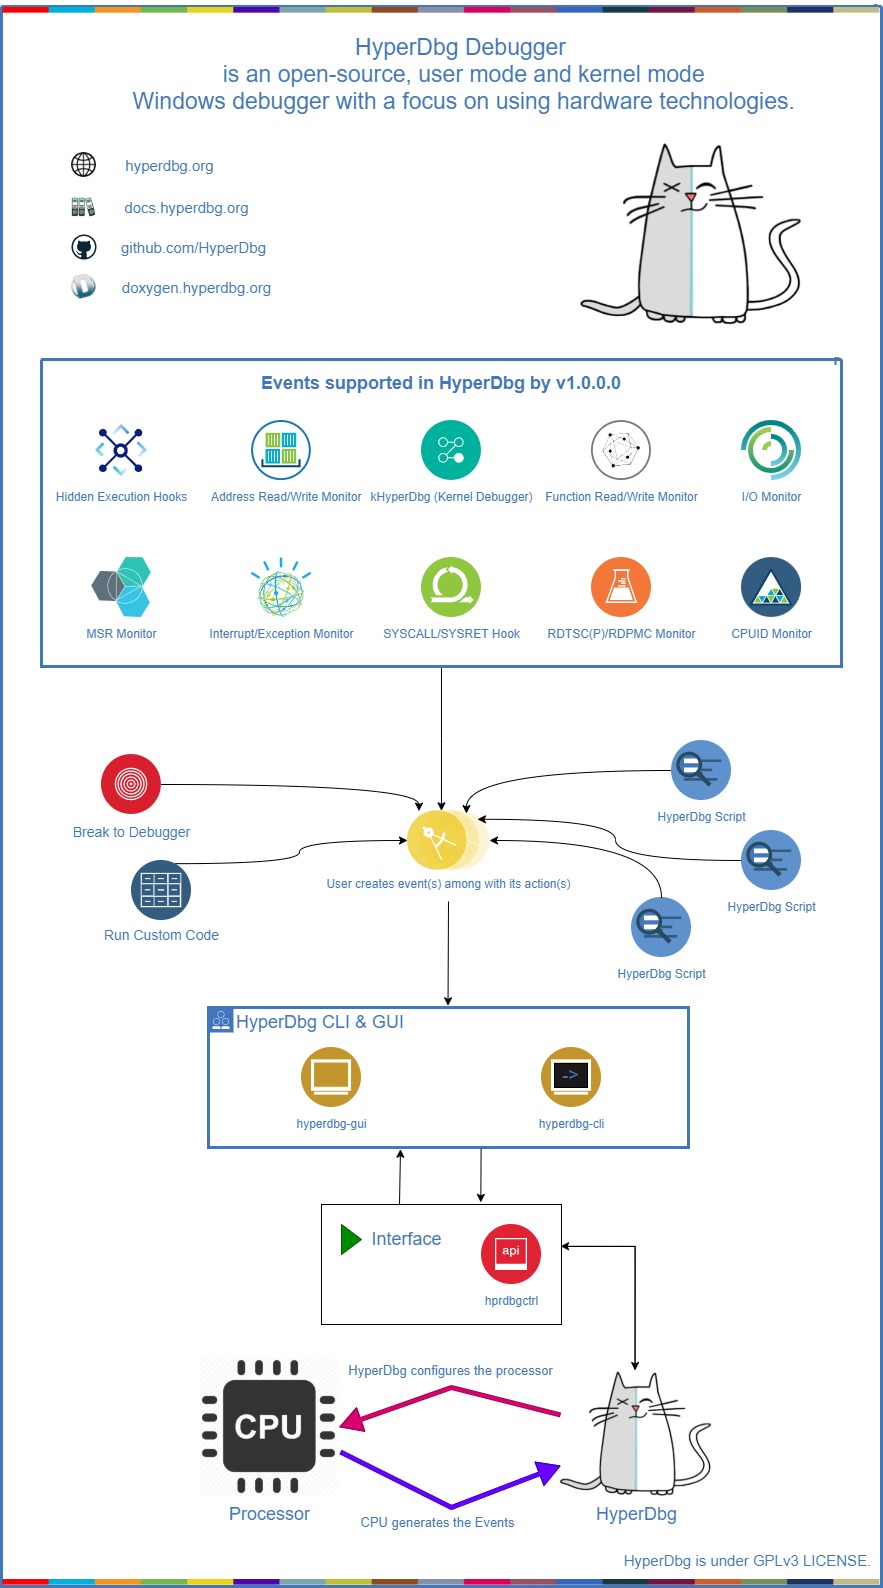
You can read about the internal design of HyperDbg and its features in the documentation. Here's a top-level diagram that shows how HyperDbg works:
Scripts
You can write your scripts to automate your debugging journey. HyperDbg has a powerful, fast, and entirely kernel-side implemented script engine.
Contributing
Contributing to HyperDbg is super appreciated. We have made a list of potential tasks that you might be interested in contributing towards.
If you want to contribute to HyperDbg, please read the Contribution Guide.
License
HyperDbg, and all its submodules and repos, unless a license is otherwise specified, are licensed under GPLv3 LICENSE.
Dependencies are licensed by their own.